
Wealden had 2,275 claimants in August, up 11% in a year, the steepest rise in East Sussex. Crowborough's six wards held at 235, all below the district rate.
Wealden had 2,275 people claiming unemployment-related benefits in August 2026. That is 225 more than a year earlier, a rise of 11.0%. It is the steepest rise of the five East Sussex districts for the second month running. (ONS claimant count via nomis)
Wealden still has the county’s lowest claimant rate, at 2.4% of residents aged 16 to 64. The rate for East Sussex as a whole is 3.7%, the South East’s 3.1% and the UK’s 3.9%.
Crowborough did not share in the rise. Its six wards had 235 claimants between them in August, five fewer than in July.
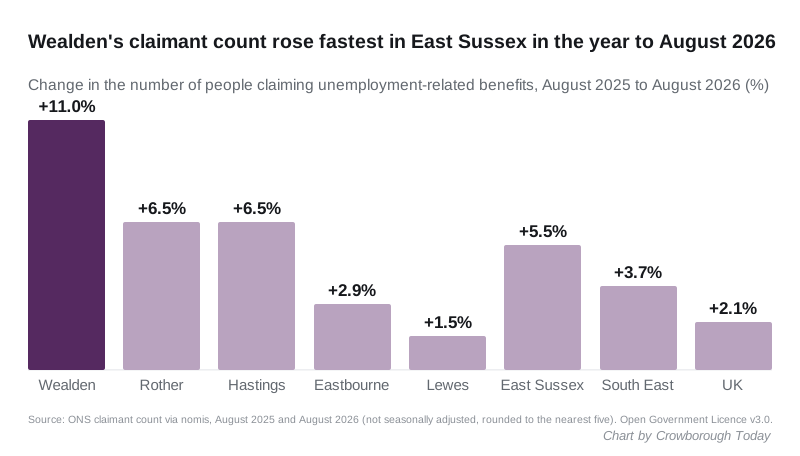
Wealden against its neighbours
| Area | August 2025 | August 2026 | Change | Rate |
|---|---|---|---|---|
| Wealden | 2,050 | 2,275 | +11.0% | 2.4% |
| Rother | 1,550 | 1,650 | +6.5% | 3.2% |
| Hastings | 2,620 | 2,790 | +6.5% | 5.0% |
| Eastbourne | 2,885 | 2,970 | +2.9% | 4.9% |
| Lewes | 1,985 | 2,015 | +1.5% | 3.5% |
| East Sussex | 11,090 | 11,695 | +5.5% | 3.7% |
| South East | 178,670 | 185,290 | +3.7% | 3.1% |
| United Kingdom | 1,663,580 | 1,698,450 | +2.1% | 3.9% |
Source: ONS claimant count via nomis. Rate is claimants as a share of residents aged 16 to 64.
Wealden accounts for about one in five of the county’s claimants. It accounts for more than a third of the county’s rise over the year: 225 of the 605 extra claimants.
Across the 64 local authorities in the South East, six rose faster than Wealden. They were Waverley (+13.8%), Tunbridge Wells (+11.4%), Mid Sussex (+11.3%), Runnymede (+11.2%), Dartford (+11.1%) and Reigate and Banstead (+11.0%, a fraction ahead of Wealden).
The rise is in every age group, which is unusual
Nationally, the past year’s increase has been among young people and the over-50s. The number of claimants aged 25 to 49 fell, by 1.0% across the UK and by 0.2% across the South East. Wealden did not follow that pattern.
| Age band | Wealden, Aug 2025 | Wealden, Aug 2026 | Wealden change | UK change |
|---|---|---|---|---|
| 16 to 24 | 350 | 400 | +14.3% | +10.0% |
| 25 to 49 | 1,140 | 1,255 | +10.1% | -1.0% |
| 50 and over | 555 | 620 | +11.7% | +3.6% |
Source: ONS claimant count via nomis. Age bands are counts; ONS does not publish a rate for them.
The 25 to 49 group is the largest, so it drives the total. In East Sussex as a whole it rose 2.7%. In Wealden it rose 10.1%.
The figures do not say why. The claimant count records who is claiming, not the reason, and we have no source that explains the Wealden rise.
Crowborough ward by ward
| Ward | July 2026 | August 2026 | Share of 16 to 64s |
|---|---|---|---|
| Crowborough St Johns | 20 | 15 | 1.1% |
| Crowborough Jarvis Brook | 45 | 45 | 1.6% |
| Crowborough South West | 35 | 35 | 1.7% |
| Crowborough Central | 45 | 45 | 2.0% |
| Crowborough North | 40 | 40 | 2.2% |
| Crowborough South East | 55 | 55 | 2.3% |
| Crowborough total | 240 | 235 |
Source: ONS claimant count via nomis, ward geography as of May 2025. Rounded to the nearest five, so a move of five can be rounding.
All six wards are below the district’s 2.4%. Crowborough St Johns has the second-lowest rate of Wealden’s 41 wards. Only Framfield and Cross-in-Hand, at 1.0%, is lower.
The district’s highest is Hailsham East, at 5.8%. Hailsham West (4.1%), Hellingly (3.3%) and Polegate North (3.3%) are next. The ward series only starts in January 2026, so there is no year-ago comparison by ward.
July’s figure has been revised down
When we reported the July figures on 23 August, ONS put Wealden at 2,270, up 9.7% on a year earlier. The same month is now recorded as 2,225, up 7.5%.
That is normal. The ONS method allows the Universal Credit part of the count to be revised for one previous month. So the latest month is the one most likely to move, and August’s 2,275 may change when September’s figures are published on 20 October.
What the claimant count is, and is not
- It is not the unemployment rate. It counts people claiming benefits mainly for being unemployed.
- It includes some people in work. Under Universal Credit, people on low enough earnings can be required to look for more work, and they are counted.
- It is not seasonally adjusted. That is why the comparisons above are August against August.
- The local figures are labelled “official statistics in development” by ONS, and every figure is rounded to the nearest five.
What it means for you
- If you are looking for work in the Crowborough area, the district picture is tighter than a year ago. There are 225 more people claiming across Wealden than last August, spread across every age group.
- If you are 16 to 18 and out of education, work or training, the county’s Youth Employability Service is free and works one to one. East Sussex County Council lists wider employment and learning support.
- Crowborough’s own numbers are steady. The town’s 235 claimants are about one in ten of the district total.
- You can check the figures yourself. The nomis dataset publishes them free each month, by ward and by age.
See also our Wealden house prices for July and our Crowborough council tax bands.
Have your say