
The Wealden average rose £6,009 in July to £391,211, yet is still £3,195 below a year ago. Tunbridge Wells turned positive; June is revised to a 1.2% fall.
The average home in Wealden was worth £391,211 in July 2026. That is £6,009 more than in June, a rise of 1.6% in a single month, and the highest monthly figure since December.
It is still £3,195 below July 2025, when the average was £394,406. That is a fall of 0.8% over the year, and the sixth month running that Wealden has been below its level of twelve months before.
The figures are from HM Land Registry’s UK House Price Index for July 2026.
June was worse than first reported
Land Registry restates recent months as more sales are registered, and June has moved.
- We reported in September that the June average was £386,787, down 0.7% on a year. The revised figure is £385,202, down 1.2%.
- November 2025, the recent high point, now stands at £395,201. We had printed £397,891.
So July’s jump starts from a lower base than it first seemed. Single-month moves in a district this size are volatile: the average dropped to £384,035 in April, then rose again in May.
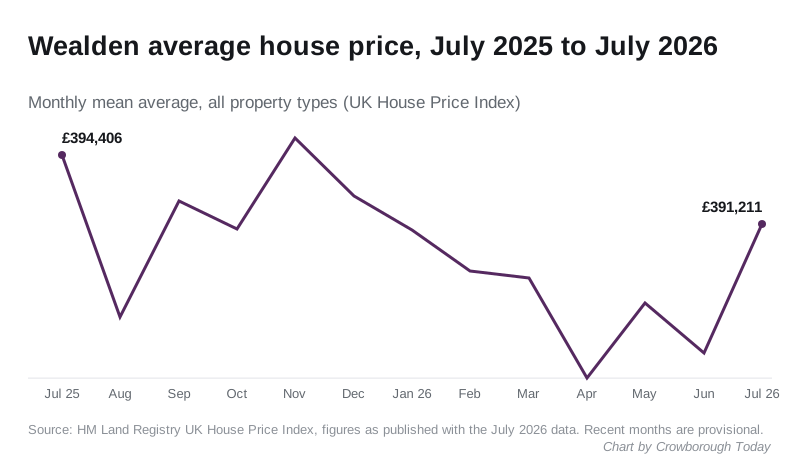
The month-by-month figures, as they stand after this release:
| Month | Wealden average | Annual change |
|---|---|---|
| July 2025 | £394,406 | -0.6% |
| August 2025 | £386,878 | -2.6% |
| September 2025 | £392,279 | -3.1% |
| October 2025 | £390,957 | -4.2% |
| November 2025 | £395,201 | -2.2% |
| December 2025 | £392,516 | 0.0% |
| January 2026 | £390,949 | +0.3% |
| February 2026 | £388,998 | -0.1% |
| March 2026 | £388,678 | -0.9% |
| April 2026 | £384,035 | -0.5% |
| May 2026 | £387,522 | -1.2% |
| June 2026 | £385,202 | -1.2% |
| July 2026 | £391,211 | -0.8% |
How the neighbours did
Of the seven districts around Wealden, three were up on a year and four were down. Three of those fell further than Wealden.
| Area | Average, July 2026 | Annual change |
|---|---|---|
| Lewes | £368,408 | +0.8% |
| Tunbridge Wells | £456,227 | +0.6% |
| Rother | £337,816 | +0.5% |
| South East region | £380,878 | +0.2% |
| Mid Sussex | £430,777 | -0.2% |
| Wealden | £391,211 | -0.8% |
| East Sussex (county) | £316,959 | -1.0% |
| Eastbourne | £254,636 | -1.6% |
| Hastings | £238,757 | -4.9% |
| Tandridge | £482,599 | -5.0% |
Tunbridge Wells is the swing. In June it was down 2.3% on a year, on the revised figures. In July it was up 0.6%, with an average of £456,227. For Crowborough households who look north across the county line, that is the market that has turned.
Tandridge, the Surrey district around Oxted, and Hastings are still falling by around 5% a year.
Nationally, the UK average rose 1.4% to £272,611, and England’s rose 1.1% to £293,479. Wealden now sits £10,333 above the South East average.
All of these are mean averages from the House Price Index, not medians. The index adjusts for the mix of homes sold, but a mean is still pulled up by a few large sales.
Which homes lost value
| Type | Average, July 2026 | Annual change |
|---|---|---|
| Detached | £592,872 | -1.1% |
| Semi-detached | £351,715 | +0.1% |
| Terraced | £291,498 | -0.2% |
| Flat or maisonette | £184,692 | -3.5% |
| First-time buyer average | £297,510 | -0.6% |
Semi-detached homes were again the only type up on a year, and only by 0.1%. Flats fell hardest, down 3.5%. Every type rose between June and July, by between 1.5% and 1.8%.
What it means for you
- One good month is not a turn. The district has been below its year-earlier level every month since February. July needs to hold before it counts as a recovery.
- Selling a flat? Flats remain the weakest part of the Wealden market, down 3.5% on a year.
- Buying a first home? The first-time buyer average is £297,510, down 0.6% on a year. That is little change in affordability.
- Wealden is not Crowborough. The district runs from Ashdown Forest to Polegate and includes cheaper Hailsham. For prices actually paid in TN6, see our Crowborough house prices page.
- Expect July to move too. The latest months are provisional and are usually restated in the next release.
Related
- Wealden house prices, June 2026: last month’s figures, now revised.
- Crowborough council tax bands: what each band pays.
Have your say