
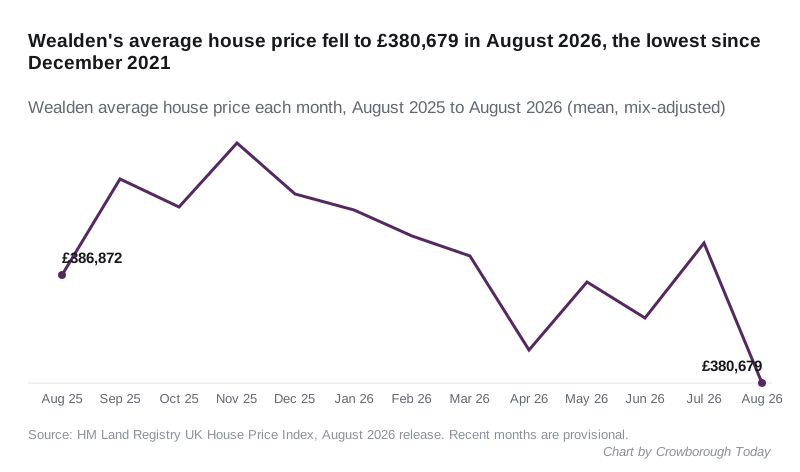
The Wealden average fell £8,074 in August to £380,679, the lowest since December 2021 and 1.6% down on a year. Every type of home lost value in the month.
The average home in Wealden was worth £380,679 in August 2026. That is £8,074 less than in July, a fall of 2.1% in a single month.
It is the lowest monthly average for the district since December 2021, when it stood at £378,706.
Over the year, the average is £6,193 below August 2025, a fall of 1.6%. It is the seventh month running that Wealden has been below its level of twelve months before.
The figures are from HM Land Registry’s UK House Price Index for August 2026. Recent months are provisional and are often restated.
July’s rise has shrunk
When we reported the July figures last month, the average was £391,211, up £6,009 in a month. The revised July figure is £388,753, up about 1.1%.
So the July bounce was smaller than it first looked, and August has more than wiped it out.
The month-by-month figures, as they stand after this release:
| Month | Wealden average | Annual change |
|---|---|---|
| August 2025 | £386,872 | -2.6% |
| September 2025 | £392,400 | -3.1% |
| October 2025 | £390,829 | -4.2% |
| November 2025 | £394,479 | -2.4% |
| December 2025 | £391,552 | -0.3% |
| January 2026 | £390,660 | +0.2% |
| February 2026 | £389,151 | -0.1% |
| March 2026 | £388,015 | -1.1% |
| April 2026 | £382,600 | -0.8% |
| May 2026 | £386,508 | -1.5% |
| June 2026 | £384,434 | -1.3% |
| July 2026 | £388,753 | -1.4% |
| August 2026 | £380,679 | -1.6% |
Source: UK House Price Index, August 2026 release.
How the neighbours did
Wealden’s 2.1% fall in August was the sharpest monthly drop of any district around it. Over the year, only Lewes was clearly up.
| Area | Average, August 2026 | Change on July | Change on a year |
|---|---|---|---|
| Lewes | £374,305 | +1.0% | +1.5% |
| Tunbridge Wells | £452,845 | +0.4% | -0.1% |
| Eastbourne | £255,642 | +0.6% | -0.7% |
| Mid Sussex | £431,904 | +0.5% | -0.8% |
| South East region | £379,953 | -0.1% | -0.8% |
| East Sussex (county) | £315,247 | -0.4% | -1.0% |
| Tandridge | £506,774 | +5.0% | -1.1% |
| Wealden | £380,679 | -2.1% | -1.6% |
| Rother | £335,680 | -0.9% | -1.9% |
| Hastings | £238,780 | +0.5% | -2.5% |
Source: UK House Price Index, August 2026.
Wealden is now only £726 above the South East average. A month ago, on the first July figures, the gap was more than £10,000.
Nationally, England’s average rose 0.4% on a year to £293,525, and the UK’s rose 0.9% to £273,037.
All of these are mean averages from the House Price Index, not medians. The index adjusts for the mix of homes sold, but a mean is still pulled about by a few large sales, and a district of Wealden’s size can swing sharply in one month.
Every type of home fell in August
| Type | Average, August 2026 | Change on July | Change on a year |
|---|---|---|---|
| Detached | £575,010 | -2.4% | -2.1% |
| Semi-detached | £341,952 | -2.1% | -0.9% |
| Terraced | £285,348 | -1.6% | -0.6% |
| Flat or maisonette | £180,919 | -1.5% | -3.6% |
| First-time buyer average | £289,839 | -1.3% |
Source: UK House Price Index, August 2026.
In July, every type rose. In August, every type fell. Detached homes fell furthest in the month. Flats are still the weakest over the year, down 3.6%.
What it means for you
- One bad month is not a crash. July’s first figure looked like a recovery and was revised down. August’s will probably be revised too. The steadier signal is the annual change, which has been negative but small, between 0% and 2%, every month since February.
- Selling a detached house? Detached homes lost 2.4% of their average value in a month.
- Buying a first home? The first-time buyer average is £289,839, down 1.3% on a year.
- Wealden is not Crowborough. The district runs from Ashdown Forest to Polegate and includes cheaper Hailsham. For prices actually paid in TN6, see our Crowborough house prices page.
Related
- Wealden house prices, July 2026: last month’s figures, now revised.
- Wealden claimant count, September 2026: the district’s jobs figures, out the same week.
- Crowborough council tax bands: what each band pays.
Have your say