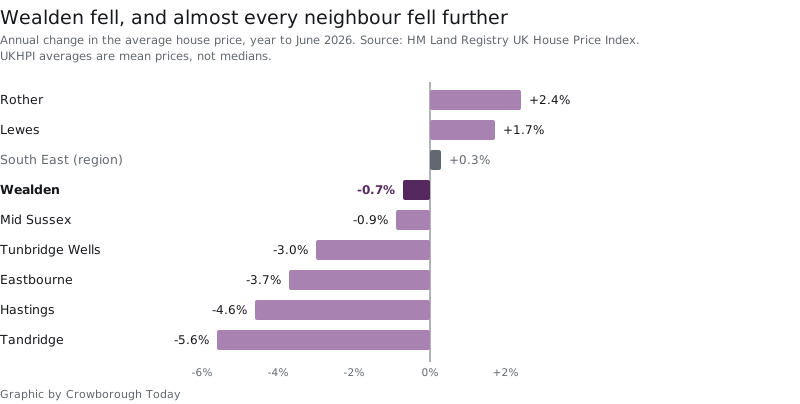

The Wealden average is £386,787, down £2,897 in a year. Only semi-detached homes rose. Hastings, Eastbourne, Tunbridge Wells and Tandridge all fell further.
The average home in Wealden was worth £386,787 in June 2026, £2,897 less than a year earlier. That is a fall of 0.7%, and the fifth month in a row that the district has been below where it was twelve months before. The average is also £11,104 below its November 2025 level of £397,891.
Read on its own, that looks like a district going backwards while the country goes forwards: the UK average rose 2.0% over the same year, to £272,188.
Put it next to the neighbours and it reads differently. Of the eight districts and boroughs that ring Wealden or sit closest to it, only two rose. Six fell, and five of those fell harder than Wealden did.
How the neighbours did
| Area | Average, June 2026 | Annual change |
|---|---|---|
| Rother | £343,870 | +2.4% |
| Lewes | £367,918 | +1.7% |
| South East region | £380,380 | +0.3% |
| Wealden | £386,787 | -0.7% |
| Mid Sussex | £426,441 | -0.9% |
| Tunbridge Wells | £445,133 | -3.0% |
| Eastbourne | £251,811 | -3.7% |
| Hastings | £236,966 | -4.6% |
| Tandridge | £475,344 | -5.6% |
Tunbridge Wells is the one worth pausing on. A year ago it was the runaway riser in this group, up 10.2% in the year to June 2025. Twelve months later it is down 3.0%, and the average there has dropped £13,860 to £445,133. Tandridge, the Surrey district on the other side of the county line towards Oxted, has lost £28,378 off its average in a year.
Wealden’s own position relative to its region has narrowed almost to nothing. The district average is now only £6,407 above the South East average, and the region rose slightly while Wealden fell. Across East Sussex as a whole the average was £315,739, down 0.9%.
All of these are mean averages produced by the UK House Price Index, not medians, and the index adjusts for the mix of properties sold. A mean is pulled upward by a handful of large sales, which is why the Wealden figure sits well below what a house in Crowborough itself tends to fetch.
Which homes lost value
Only one property type in Wealden was worth more in June than a year before.
| Type | Average, June 2026 | Annual change | Change in cash |
|---|---|---|---|
| Detached | £586,588 | -1.3% | -£7,978 |
| Semi-detached | £348,205 | +0.4% | +£1,389 |
| Terraced | £286,892 | -0.1% | -£204 |
| Flat or maisonette | £182,646 | -2.9% | -£5,500 |
| First-time buyer average | £294,340 | -0.2% | -£696 |
Semi-detached homes were the only risers, and only just, at £1,389 over the year. The falls are concentrated at the two ends: detached houses lost the most in cash, nearly £8,000, and flats lost the most in percentage terms.
That pattern is not unique to Wealden. Flats fell in every neighbouring district except Rother, and they fell across the South East as a whole, down 2.5% while semi-detached homes in the region rose 1.6%.
For anyone buying a first home, the practical number is £294,340. It has barely moved in a year, down £696, which means the affordability gap in the district has closed by almost nothing.
What it means for you
- The district figure is not the Crowborough figure. Wealden runs from Ashdown Forest down to Polegate and takes in Hailsham, a much cheaper market. The typical home actually sold in TN6 goes for considerably more. Our Crowborough house prices page sets out the local median and the sales behind it.
- If you are selling a flat, price against the direction of travel. Flats are the only Wealden type that has fallen by more than 1% in the year, and they have fallen across the region too.
- If you are moving within the area, the gaps have shifted. Tunbridge Wells and Tandridge have both come down sharply from a much higher base, which changes what the same money buys across the county line.
- Expect a revision. UKHPI figures for recent months are provisional and are restated as more completed sales are registered.
June’s figures were published on 19 August 2026. The next release, covering July 2026, is due at 9.30am on Wednesday 16 September. The full dataset for the district, month by month, is on the UK House Price Index.
Related
- Crowborough house prices: the TN6 median, by property type.
- Crowborough council tax bands: what a band D bill looks like across all 42 Wealden parishes.
- Crowborough planning news
Update, 25 September 2026: Land Registry has revised the June figures with its July release. The Wealden June average is now £385,202, down 1.2% on a year (we reported £386,787, down 0.7%), and November 2025 now stands at £395,201 (we reported £397,891). Neighbouring figures have also moved. The July figures, with the revised series, are in our July 2026 update.
Have your say